Exploratory analysis and treatment of outliers for numerical values
-
We will essentially examine each feature to:
- Conduct a correlation analysis among the features to ascertain their interrelationships and determine whether to retain all features. Features exhibiting strong correlations to the extent that they provide redundant information to the model will be removed.
- Eliminate outliers (using a rule where values below Q1 - 1.5 * Interquartile Range and above Q3 + 1.5 Interquartile Range will be excluded). Interquartile Range (IQR) = Q3 - Q1.
- Verify if all features are relevant for our model or if any of them will not contribute and should be removed.
-
We will begin by creating graphs to facilitate parts of our analysis
-
Then, we will analyize the columns of price (the ultimate target variable) and extra_people (also a monetary value). These are continuous numerical values.
-
Next, we will analyze the columns of discrete numerical values (accommodates, bedrooms, guests_included, etc.).
-
Finally, we will evaluate the text columns and determine which categories make sense to retain or discard.
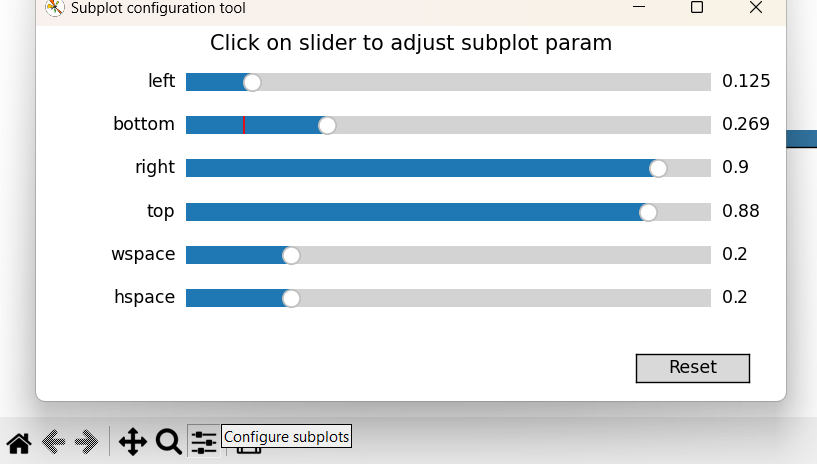
NOTE: If x axis of the graphs is slightly cropped off the screen due to the size of the graph, go to the configure subplots button (second to last button located on the bottom left of the screen) and adjust the 'bottom' slider until the x axis appears on your desired position.
